In today’s world, with the growing adoption of microservice architecture and cloud computing, monitoring and observing your system has evolved from being optional to an absolute necessity.
Monitoring is the continuous tracking and analysis of a system’s performance, behavior, and health to ensure it operates as expected.
It involves collecting data, analyzing it, and generating insights to maintain system reliability, performance, and availability.
The goal of this article is to show how to monitor key performance metrics of a Spring Boot application, such as memory and CPU usage, throughput (requests per minute), and average latency (response time per request in milliseconds), using Prometheus and Grafana.
For this tutorial, I will be using OpenJDK 21, Spring Boot 3.4.1, Apache Maven 3.9.9, Docker, and Postman.
The complete code referenced in this article is available on Git:
https://github.com/Achraf-Hasbi/spring-boot-actuator
Application setup
First, let’s create our application using Spring Initializr at https://start.spring.io/. We will need the following dependencies, as shown in the screenshot below: Spring Web, Lombok and Spring Boot Actuator.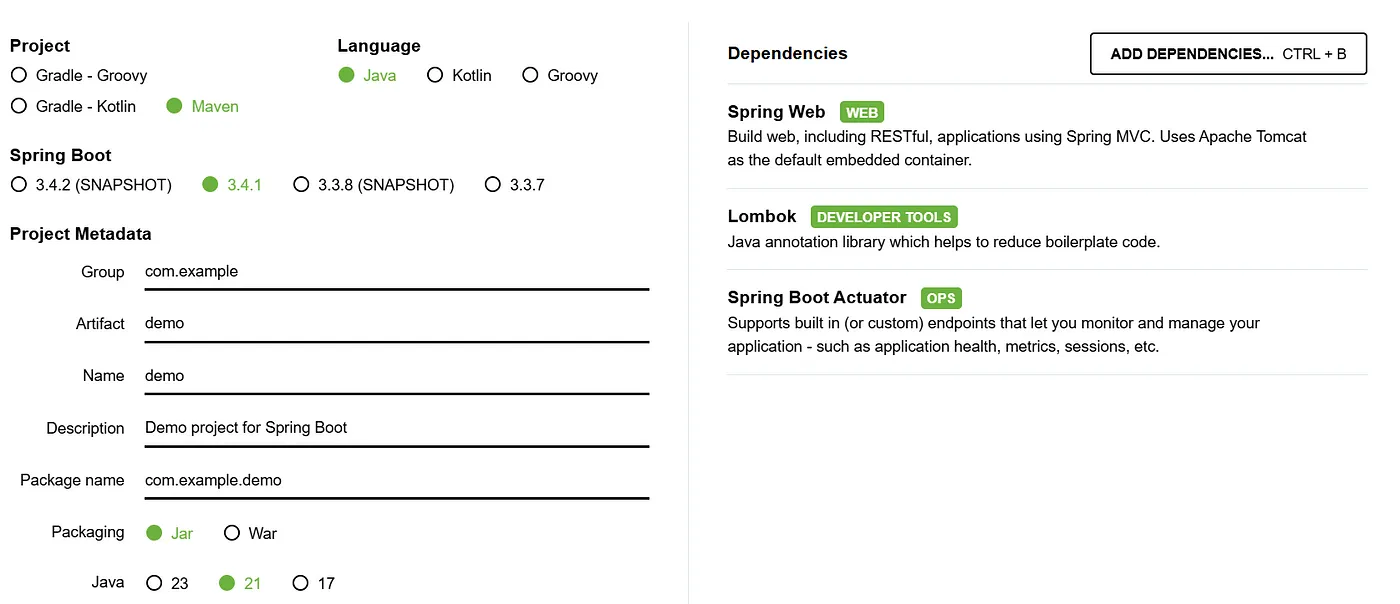
Now, download the project, unzip the archive, and add the “Greeting” controller with a GET endpoint that we will monitor. This endpoint will simply sleep for a random period between 0 and 5 seconds and then return a string. We will also use the Timer to record the number of calls to the endpoint and the total duration of those calls.
@RestController
@RequiredArgsConstructor
public class GreetingController {

    @GetMapping("/greeting")
    @Timed(value = "my.greeting", extraTags = {"env", "local"})
    public String greeting() throws InterruptedException {
        // Sleep between 0s and 5s
        Thread.sleep((long) (Math.random() * 5000));

        return "Hello From Spring Boot App !";
    }
}
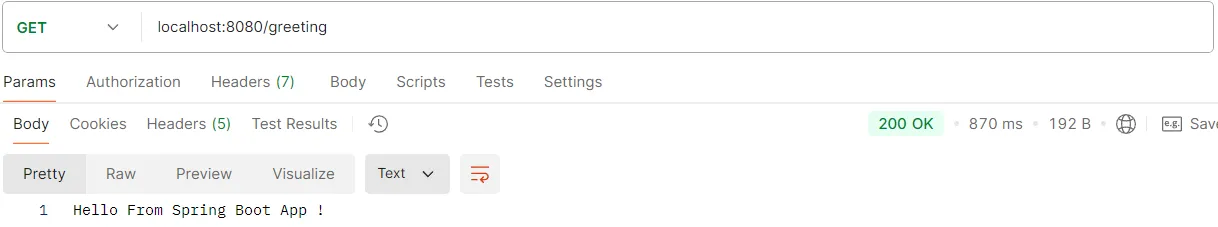
Let’s verify that our endpoint behaves as expected by running the application and calling the endpoint using Postman.
We’ve applied the @Timer annotation to our endpoint.
This Micrometer annotation captures both the number of times the endpoint is called and its total execution time, which will be used later to monitor throughput and latency.
There are many other meters available to expose different metrics; to learn more, visit: Micrometer Documentation.
By default, these annotations are disabled.
To enable them, add the following property to the application.properties file:
Additionally, include the spring-aop dependency in your project:
<dependency>
    <groupId>org.springframework.boot</groupId>
    <artifactId>spring-boot-starter-aop</artifactId>
</dependency>
Prometheus Configuration
Now that our application is up and running, and the endpoint works as expected, let’s configure Prometheus and generate some metrics. Prometheus is an open-source application used for monitoring. It stores metrics in a time-series database and uses an HTTP pull model to collect data. Prometheus provides flexible querying options. To achieve this, all we need to do is add the dependency for the Prometheus registry, and Spring Actuator will handle the rest, including:- 1. Dependency management by configuring the correct version.
- 2. Autoconfiguration: Actuator will expose a
/actuator/prometheusendpoint for scraping the metrics, while also exposing default metrics such as memory usage, CPU, etc.
<dependency>
    <groupId>io.micrometer</groupId>
    <artifactId>micrometer-registry-prometheus</artifactId>
</dependency>
application.yml file:
management.endpoints.web.exposure.include=prometheus
Now, let’s restart our application and check what our /actuator/prometheus endpoint contains. You can do this by accessing the endpoint in your browser or using a tool like Postman to view the metrics that are being exposed. If everything is set up correctly, the output should look like the following:
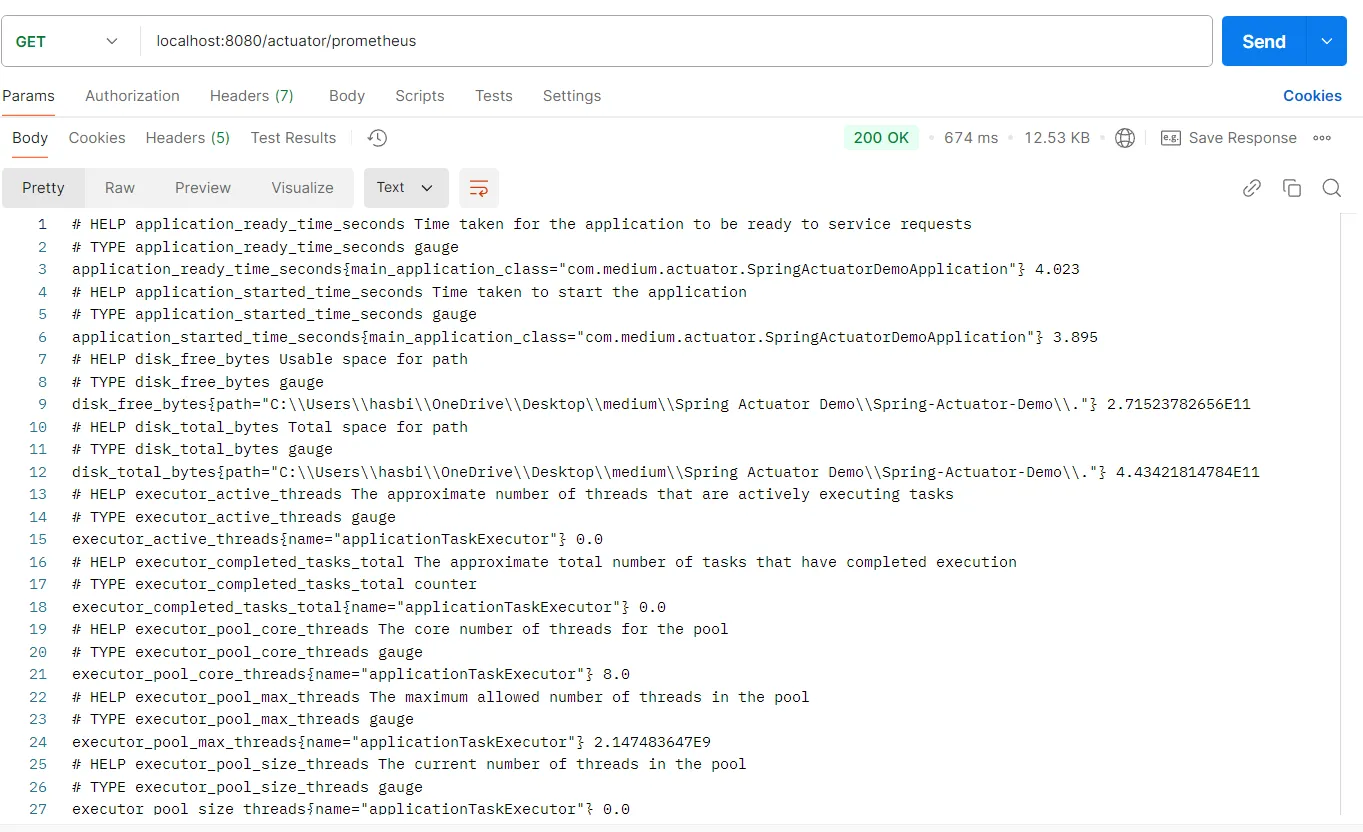
In this output, we can see several metrics exposed by default, but what will be of particular interest to us moving forward are the metrics related to CPU (process_cpu_usage), memory usage (jvm_memory_used_bytes), number of calls to our endpoint (request_greeting_seconds_count) and the sum of call durations (request_greeting_seconds_sum).
The request_greeting_seconds_count and request_greeting_seconds_sum metrics will not be available until the first call to the greeting endpoint is made.
Start Prometheus and Grafana instances on Docker
Let’s now start a Prometheus and Grafana instances using Docker. For this, we need two files:
prometheus.yml
This file will contain the scraping configuration. The following configuration scrapes our application every 5 seconds:scrape_configs:
- job_name: my-spring-boot-application
metrics_path: '/actuator/prometheus'
scrape_interval: 5s
static_configs:
- targets:
- host.docker.internal:8080
docker-compose.yml
This file will launch Prometheus and Grafana instances, making them accessible on ports 9090 and 3000, respectively, on local machine:
services:
  prometheus:
    image: prom/prometheus
    volumes:
      - "./prometheus.yml:/etc/prometheus/prometheus.yml"
    ports:
      - 9090:9090
    networks:
      - monitoring

  grafana:
    image: grafana/grafana
    container_name: grafana
    ports:
      - 3000:3000
    restart: unless-stopped
    environment:
      - GF_DASHBOARDS_MIN_REFRESH_INTERVAL=1s
    volumes:
      - grafana-data:/var/lib/grafana
      - grafana-conf:/etc/grafana
    networks:
      - monitoring

volumes:
  grafana-data:
  grafana-conf:

networks:
  monitoring:
    driver: bridge
Make sure Docker is running before proceeding with the steps.
- 1. Place the
prometheus.ymlfile and thedocker-compose.ymlfile in your project directory. - 2. Run
docker-compose upto start the Prometheus and Grafana containers. - 3. Access Prometheus by navigating to
http://localhost:9090in your browser. - 4. Access Grafana by navigating to
http://localhost:3000in your browser.
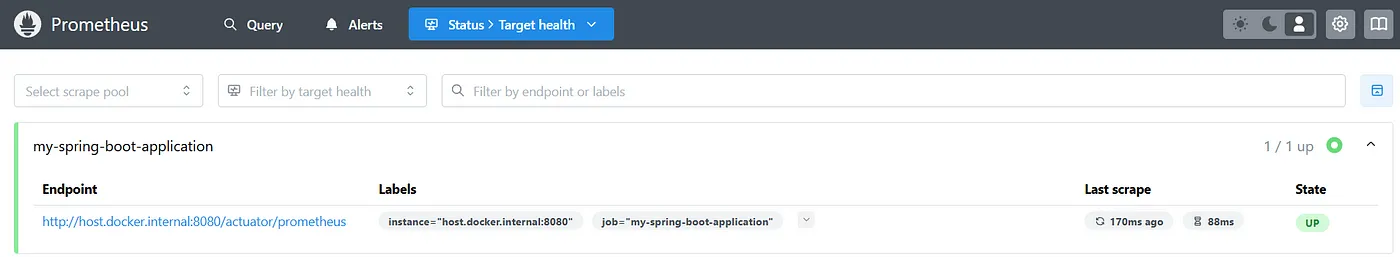
To verify that everything is properly configured, go to http://localhost:9090/targets in your browser. Your Prometheus instance should be up and running, and you should see a page listing the targets. The target for your Spring Boot application should appear, and it should show as « up » if everything is working correctly.
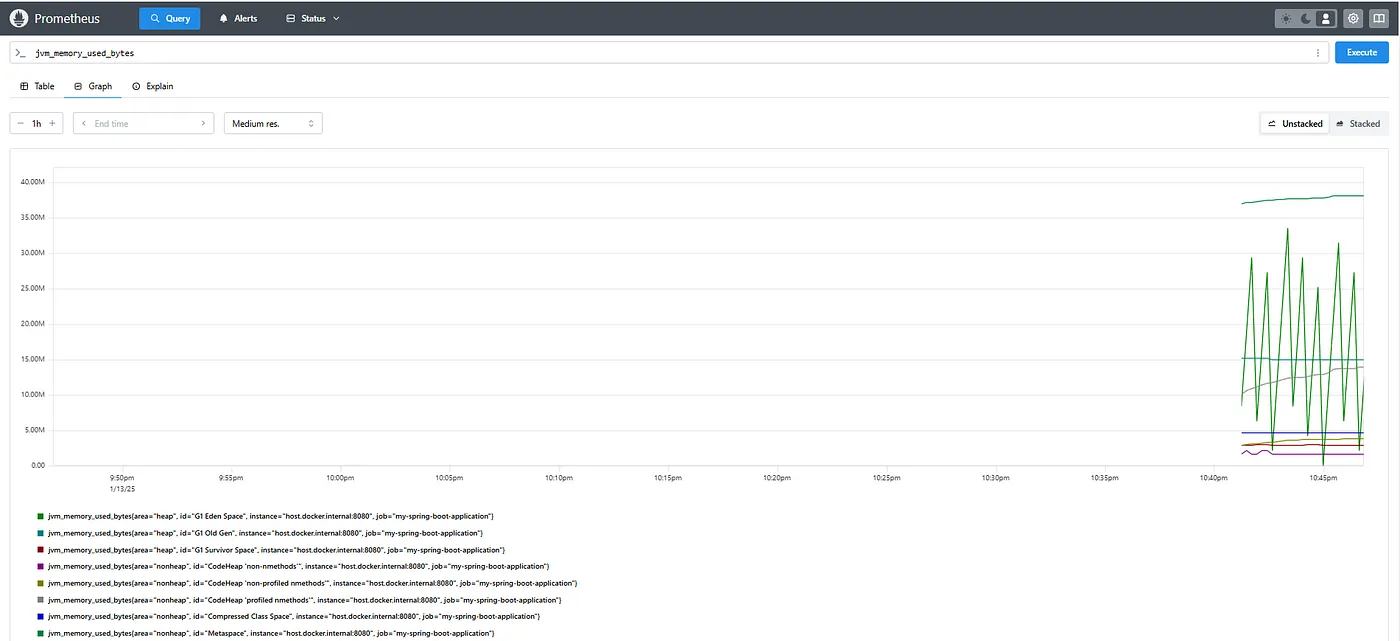
Now, Prometheus will start scraping your Spring Boot application every 5 seconds, and you can visualize the collected metrics through the Prometheus interface. For example:
- 1. Go to the “Query” tab in the Prometheus web interface.
- 2. Type
jvm_memory_used_bytesin the search box to view the memory usage for all heap and non-heap regions.
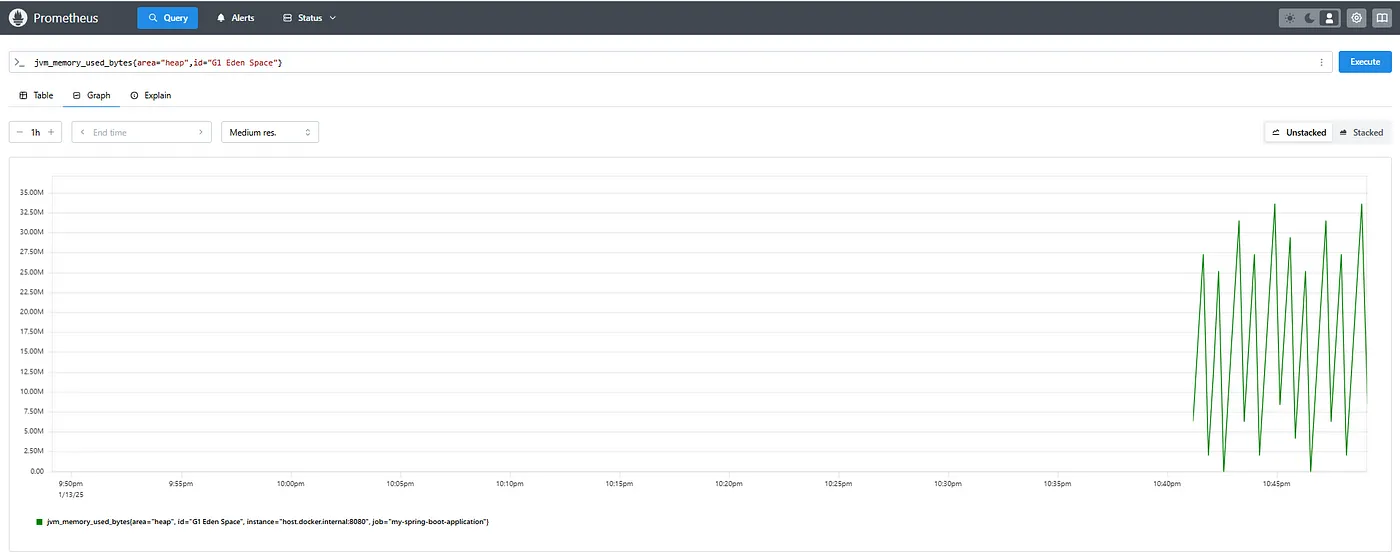
 Filter for a specific region:
You can also filter for a specific memory region, for example, the Eden Space of the heap:
Filter for a specific region:
You can also filter for a specific memory region, for example, the Eden Space of the heap:
jvm_memory_used_bytes{area="heap", id="G1 Eden Space"}
Create a Grafana Dashboard
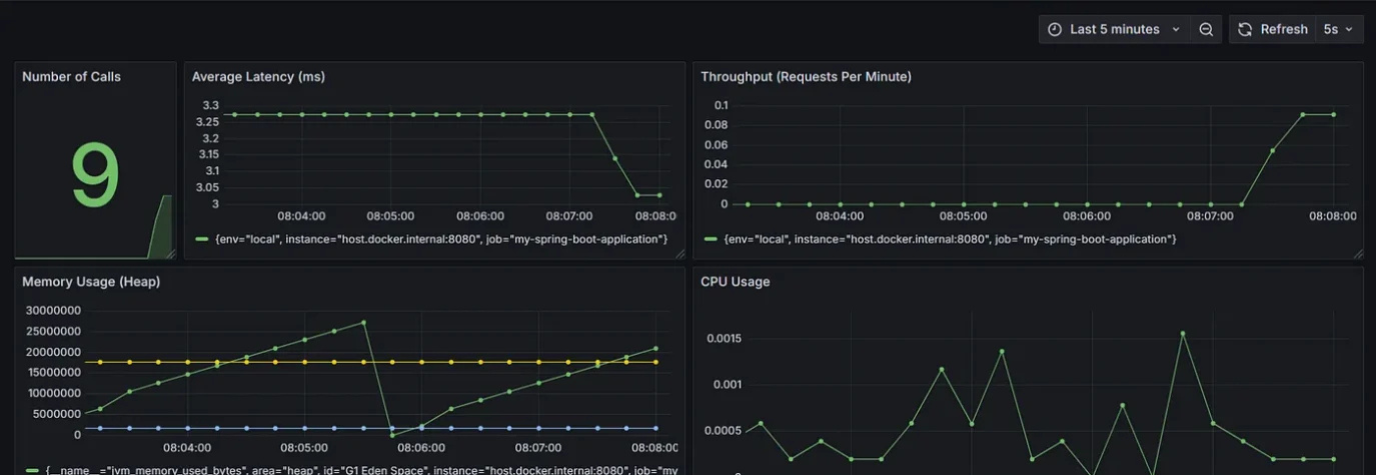
Now, let’s build a Grafana dashboard featuring the following metrics: memory and CPU usage, throughput, average latency and the total number of calls to the greeting endpoint.
Step 1: Add Prometheus as a Data Source in Grafana
- 1. Open Grafana and log in (default:
admin/admin). - 2. Go to Connections > Data Sources.
- 3. Click Add data source and select Prometheus.
- 4. Set the URL to
http://prometheus:9090. Remember to use the container name (e.g.,prometheus) instead oflocalhost. - 5. Click Save & Test.
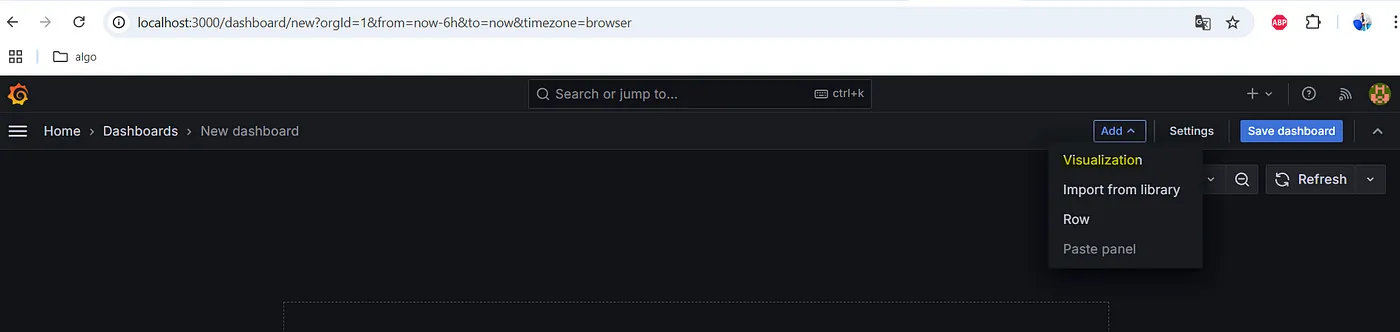
Step 2: Create a New Grafana Dashboard
Click on the Dashboard and Create dashboard.Step 3: Add Panels for Each Metric
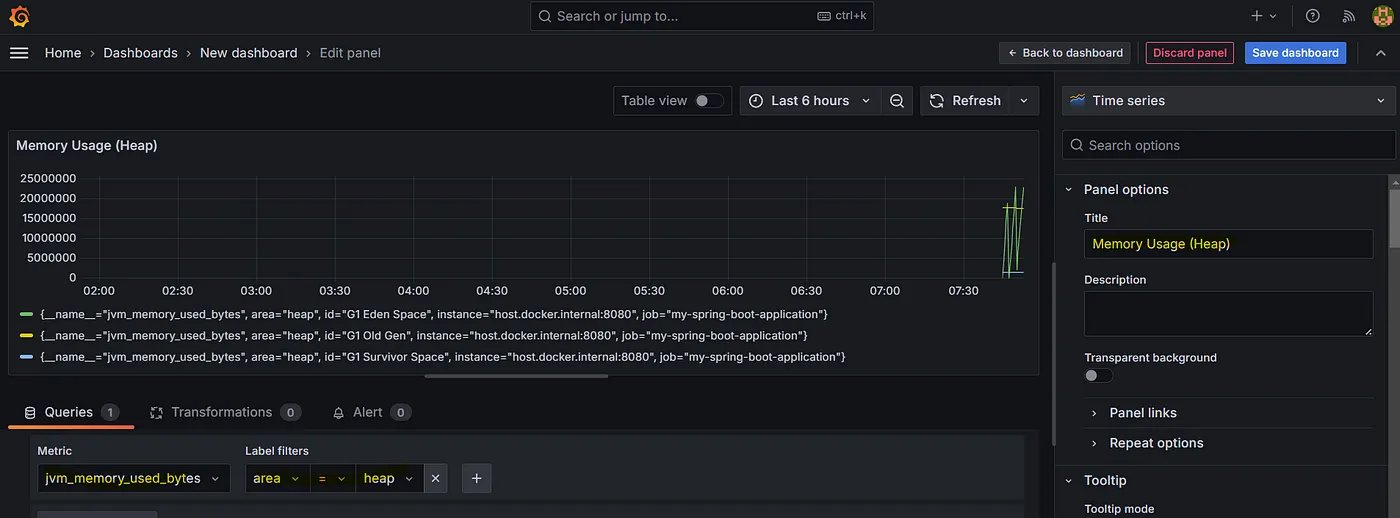
 Memory Usage Panel
Query:
Memory Usage Panel
Query:jvm_memory_used_bytes{area="heap"}
Panel title: Memory Usage (Heap)
Visualization: Time series.
Click Refresh then Save dashboard.
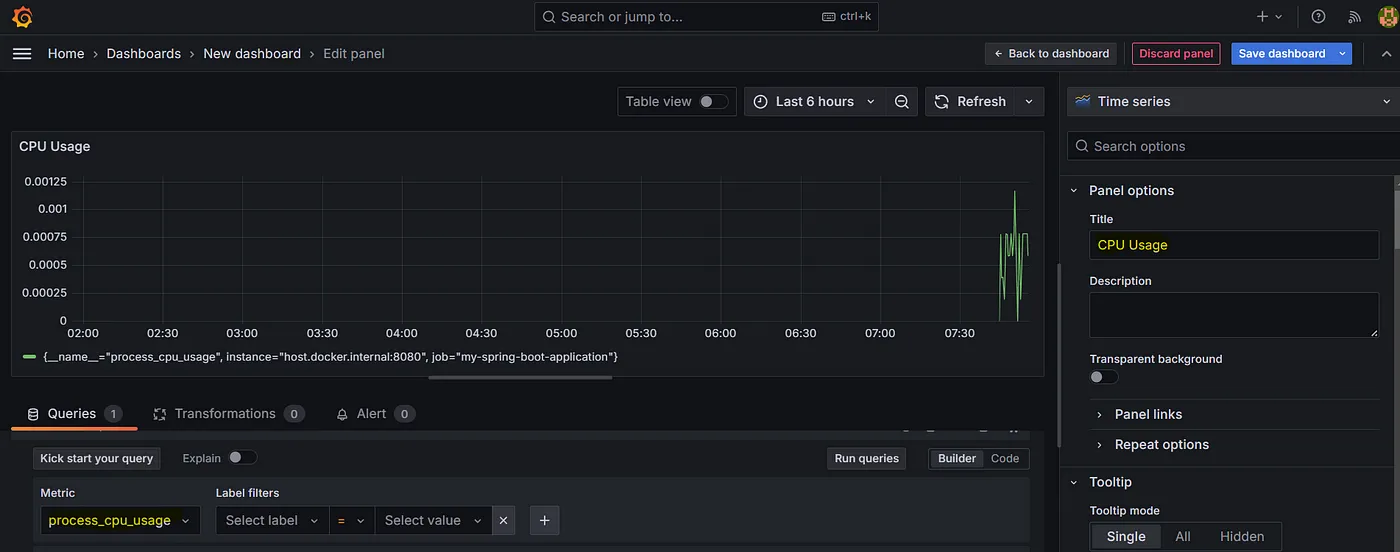
 CPU Usage Panel
Query:
CPU Usage Panel
Query: process_cpu_usage
Panel title: CPU Usage
Visualization: Time series.
Click Refresh then Save dashboard.
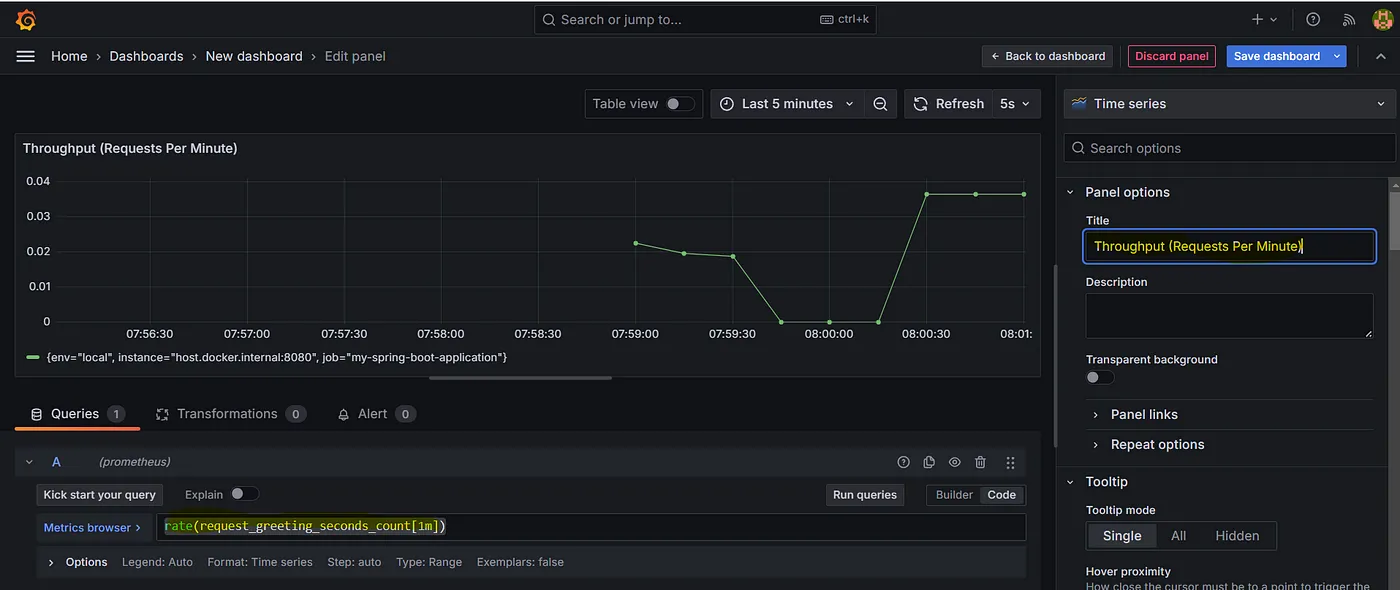
 Throughput (Requests Per Minute)
Ensure that the greeting endpoint has been called in order for its metrics to appear.
Query:
Throughput (Requests Per Minute)
Ensure that the greeting endpoint has been called in order for its metrics to appear.
Query: rate(request_greeting_seconds_count[1m])
Panel title: Throughput (Requests Per Minute)
Visualization: Time series.
Click Refresh then Save dashboard.
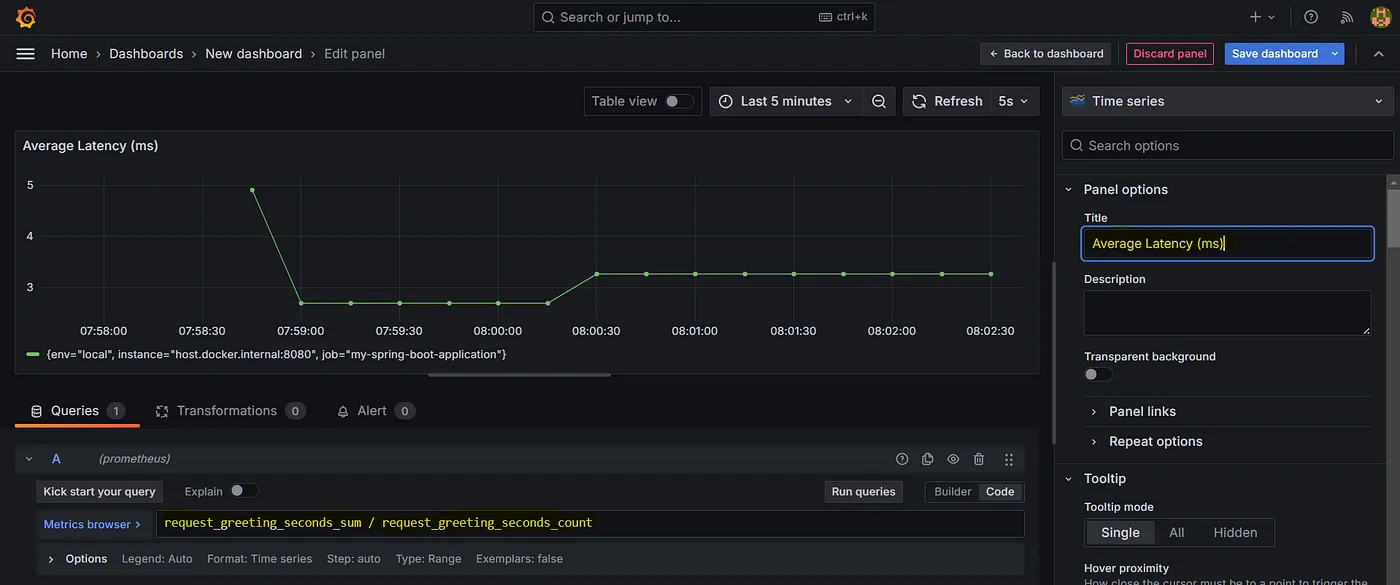
 Average Latency (Response Time per Request)
Ensure that the greeting endpoint has been called in order for its metrics to appear.
Query:
Average Latency (Response Time per Request)
Ensure that the greeting endpoint has been called in order for its metrics to appear.
Query: request_greeting_seconds_sum / request_greeting_seconds_count
Panel title: Average Latency (ms)
Visualization: Time series.
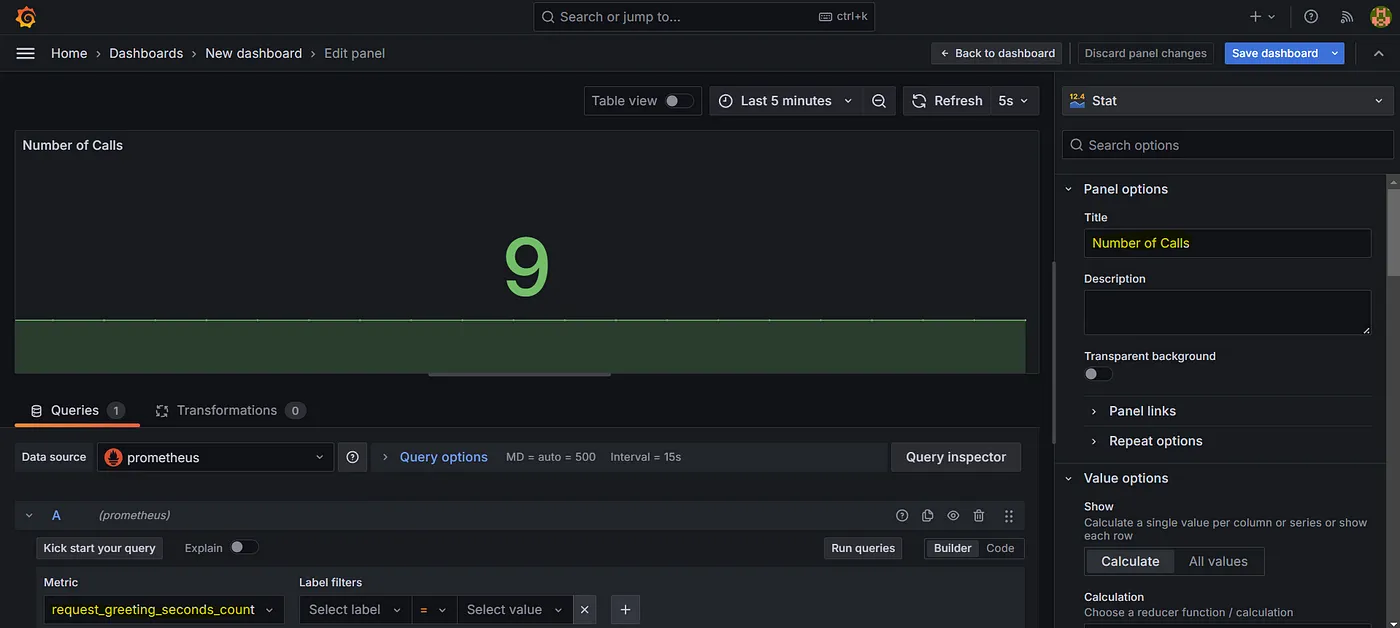
 Number of Calls to the Greeting Endpoint
Ensure that the greeting endpoint has been called in order for its metrics to appear.
Query:
Number of Calls to the Greeting Endpoint
Ensure that the greeting endpoint has been called in order for its metrics to appear.
Query: request_greeting_seconds_count
Panel title: Number of Calls to Greeting Endpoint
Visualization: Stat.
Step 4: Adjust Panel Settings
Customize time ranges, refresh intervals, and thresholds for better visibility.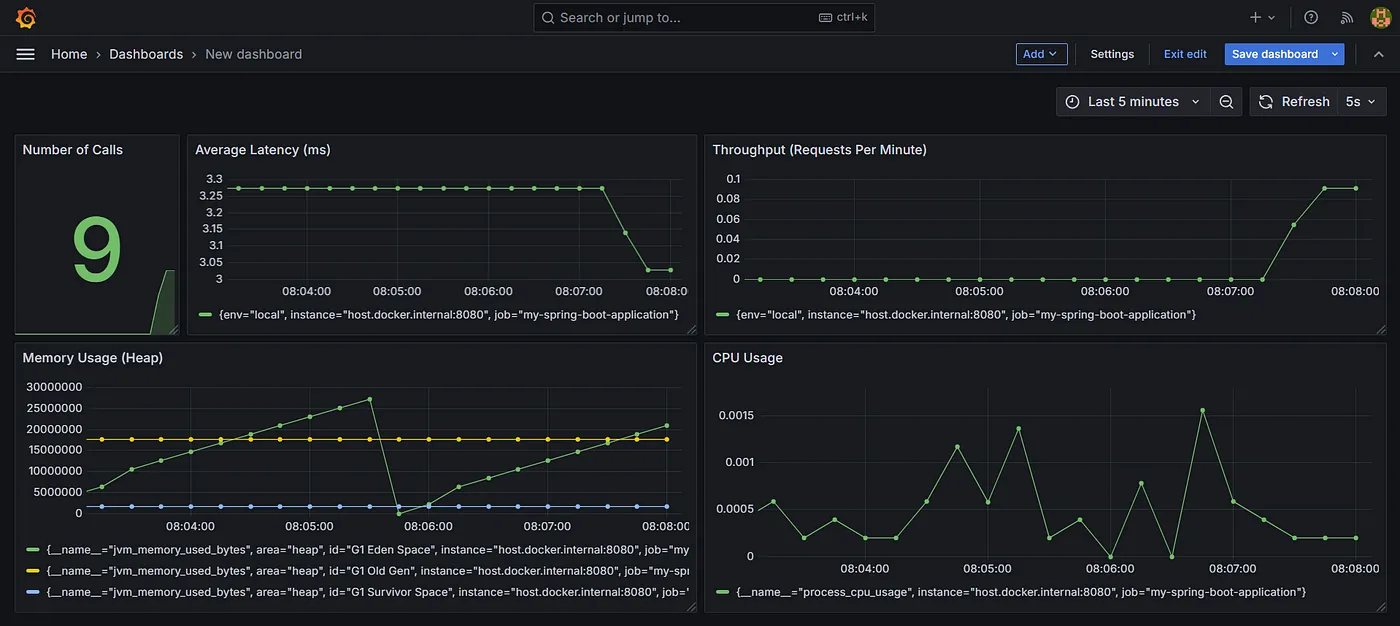
Conclusion
In this tutorial, we demonstrated how to expose key metrics of a Spring Boot application using Spring Actuator and visualize them with Prometheus and Grafana. The source code is available on GitHub:
https://github.com/Achraf-Hasbi/spring-boot-actuator. To learn more about micrometer and Spring Actuator: Micrometer:https://docs.micrometer.io/micrometer/reference/ Spring Boot Actuator: https://docs.spring.io/spring-boot/reference/actuator/index.html